Climate Across Systems | Ahmednadhir | No. 10 11 November 2026
What climate measures must prove
Regional warming, public health, carbon and satellite data raise a common question for public authorities. What does a climate measure establish about the decision it is being asked to support?
A water authority can know that its service area has warmed and still face a difficult choice about where to spend next year’s capital budget. Replacing a failing pump may protect households through the next dry season. Expanding storage may serve a growing town for decades. The temperature record explains why the old assumptions deserve another look. The spending decision depends on which supplies are vulnerable, what maintenance the authority can afford and how long each investment will be in service.
The same problem arises at a finance ministry weighing the health gains of fuel-pricing reform, and at a public buyer asked to pay for carbon storage that should outlast the contract. Each has a number to hand. Each needs to establish what the number represents and how far it can travel into a decision about people, money or legal responsibility.
Five publications issued from 4 to 10 November bring that problem into view. Their evidence ranges from estimates of warming across the world’s land regions to the experience of agencies using satellite observations in routine decisions. What connects the readings is the distance between measuring a risk and changing the conditions that produce it. A good measure makes that distance easier to see.
Climate science and infrastructure
A global threshold cannot set a local timetable
Global land regions · Sixth Assessment Report Li and colleagues · Nature Climate Change 9 November 2026
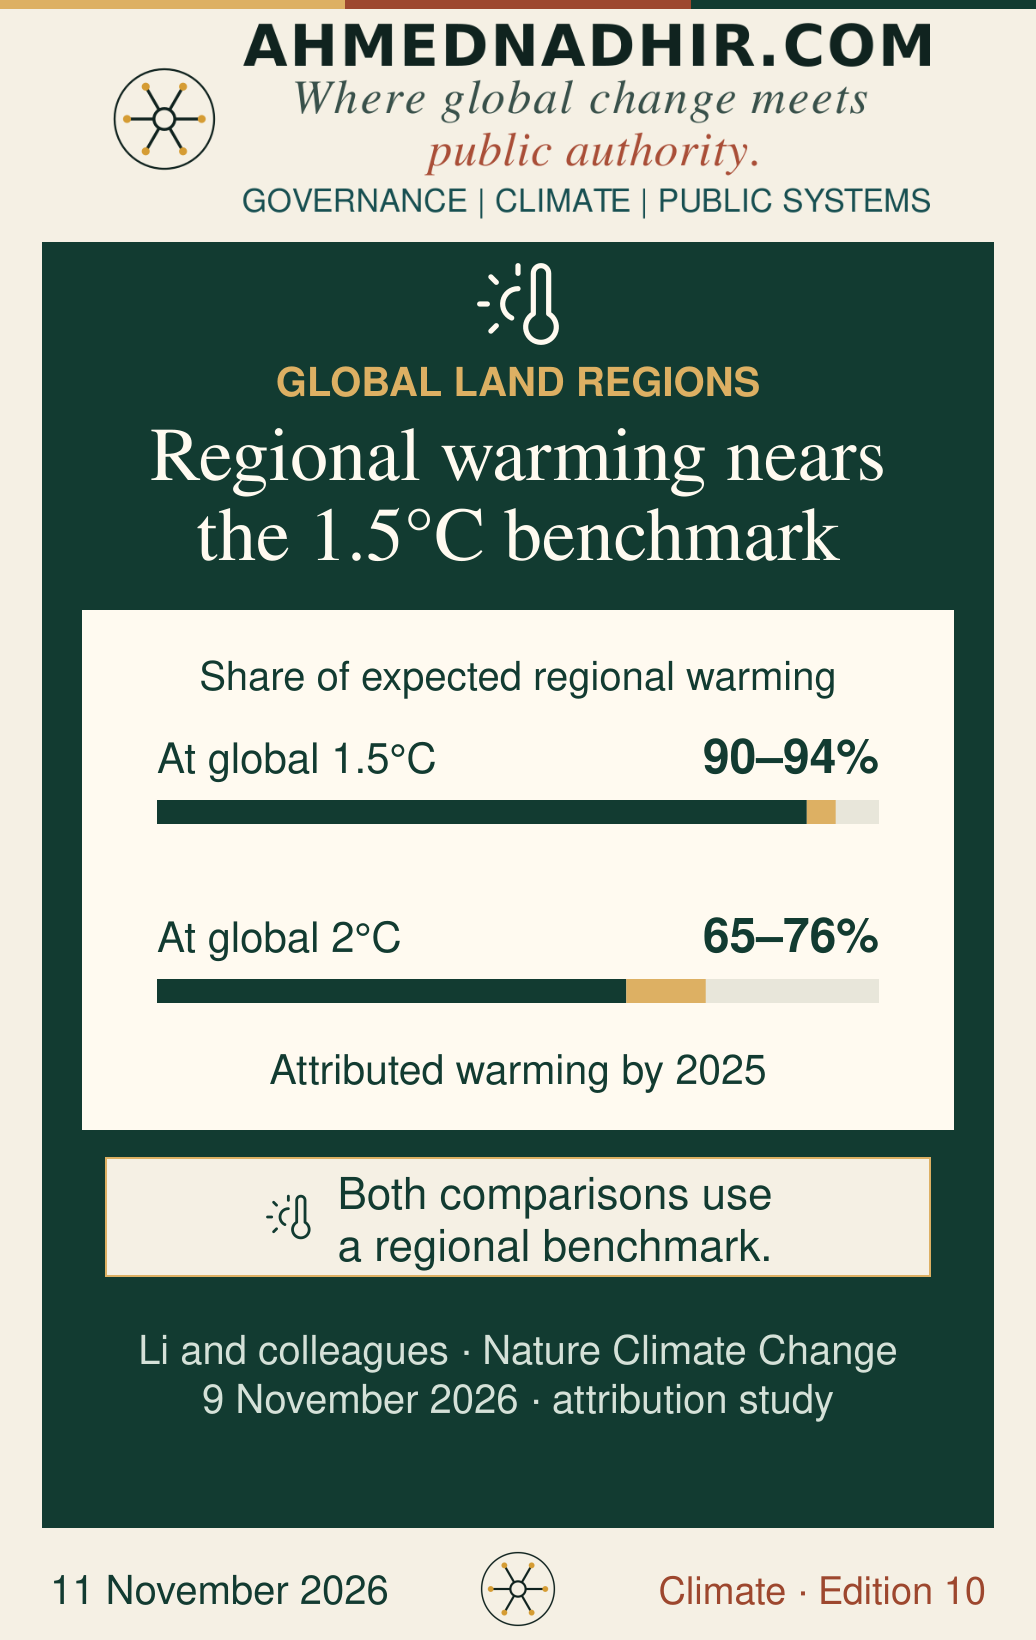
Tong Li and colleagues estimated how much warming external forces have already produced across the regions used in the Intergovernmental Panel on Climate Change’s Sixth Assessment Report. Their 9 November study combined temperature observations and simulations from several climate models in a Bayesian analysis. By 2025, estimated regional warming had reached about 90–94% of the warming expected in those regions when the global average reaches 1.5°C. The corresponding estimate for a 2°C world was 65–76%. The reference for historical warming was 1850–1900. [1]
The percentages compare attributed regional warming with the warming expected in those regions at two global benchmarks.
Those percentages compare regional warming with the regional levels expected at each global benchmark. In absolute terms, some northern high-latitude regions had already warmed by more than 2.5°C from external forcing. The authors report relatively strong attribution confidence across much of the tropics, including parts of Africa, where natural year-to-year variability can be smaller. Combining models and observations helps fill gaps in early records while leaving uncertainty about the exposure of particular towns, farms and facilities.
An infrastructure authority revising design assumptions would have reason to revisit historical weather records, especially when an asset will be in service for several decades. Its next question concerns the local mechanism of failure. For a water utility, a warmer catchment can change demand and the reliability of supply. Groundwater yields, seasonal rainfall, network leakage and the cost of pumping will determine which of those pressures matters most to the utility’s budget.
There is also a question of who receives protection first. A programme based on the largest replacement costs can favour places with the most existing infrastructure. In an area served by smaller schemes, a cheaper intervention might protect households facing longer interruptions. A regional warming estimate can justify reassessing both places. Service records and local exposure determine how the cases compare. The lead time for a decision matters too. An authority can adjust a maintenance schedule in a season. It may take years to secure land, finance and consent for greater storage.
A global health return has to survive a local budget
Global scale-up scenarios World Health Organization · Technical report 4 November 2026
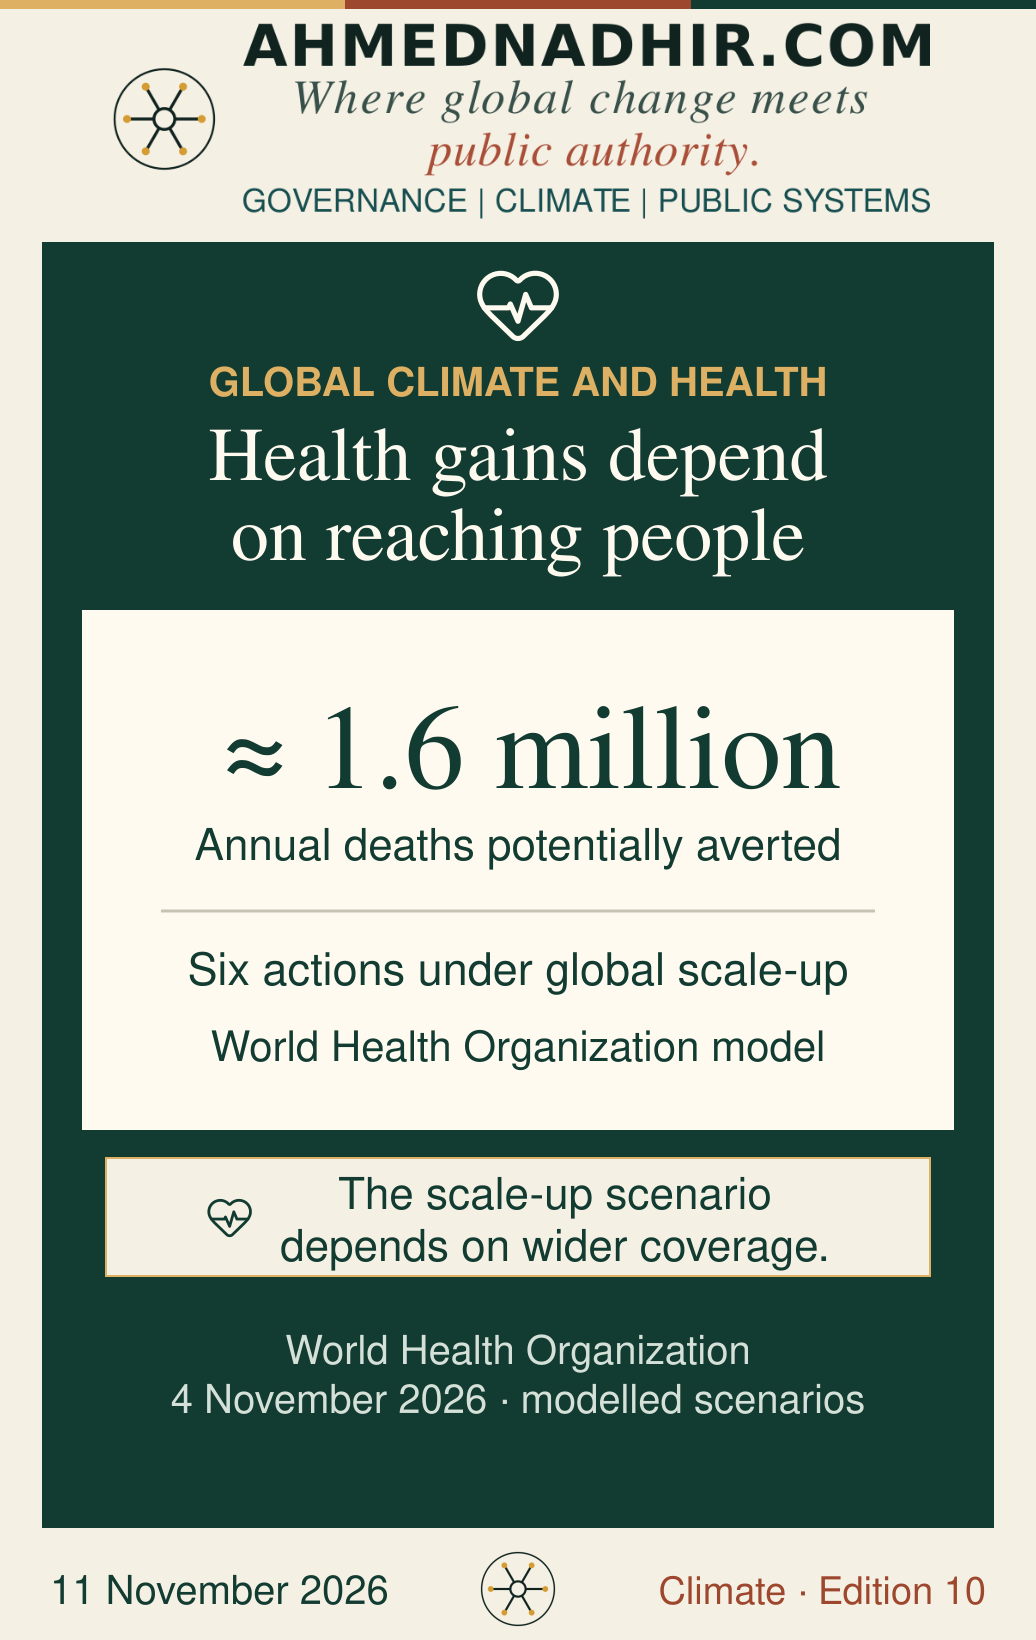
On 4 November, the World Health Organization published a technical assessment of six measures. It considered heat warnings, climate-resilient drinking water, sanitation, hand hygiene, cleaner household fuels and technologies, and more efficient fossil fuel pricing. Under its global scale-up scenarios, these measures could avert about 1.6 million deaths annually. For the five measures with a benefit–cost analysis, it estimated US$24 in benefits for every dollar invested. The scenarios compare expanded coverage with a baseline over 2024–2075. [2]
The World Health Organization estimates the potential benefit of expanded coverage. Gains depend on how measures are implemented and used.
The measures operate through different routes. A warning offers time to change behaviour. A reliable water service and usable handwashing facilities reduce exposure to pathogens. Cleaner household energy can reduce exposure to smoke when families can keep using it. Fiscal reform can change fuel use and pollution across much larger populations. The fossil fuel pricing scenario contributes about 1.2 million of the modelled deaths averted, which matters when judging what the combined estimate can say about any one service.
A district or city budgeting for heat warnings has a narrower problem. The cost of sending an alert may be low if the authorities can use existing channels. The protection it buys depends on where the message reaches, whether people recognise the danger and what they can afford to do. A household without reliable water and a worker paid by the task face constraints that the alert itself cannot remove. The costs of making the warning usable can sit with an employer, utility or local service alongside the health budget.
The report gives treasury and health officials a basis for comparing the scale of possible benefits. A proposal for a particular place still needs its own estimate of reach, uptake and recurring costs. Monetised health gains belong in that appraisal alongside spending and fiscal effects. They help a treasury judge the public value of an intervention. The authority still needs cash for staff, equipment and repairs in the years when the gains are expected.
Fuel-pricing reform adds a distributional question. The household that pays more for transport or cooking may differ from the household that benefits most from cleaner air. The path to the estimated gains depends in part on how the transition is financed. The availability of an affordable substitute can determine whether a price change reduces fuel use or mainly raises the cost of getting to work.
Global carbon accounts · 2026 projection Global Carbon Project · Global Carbon Budget 10 November 2026
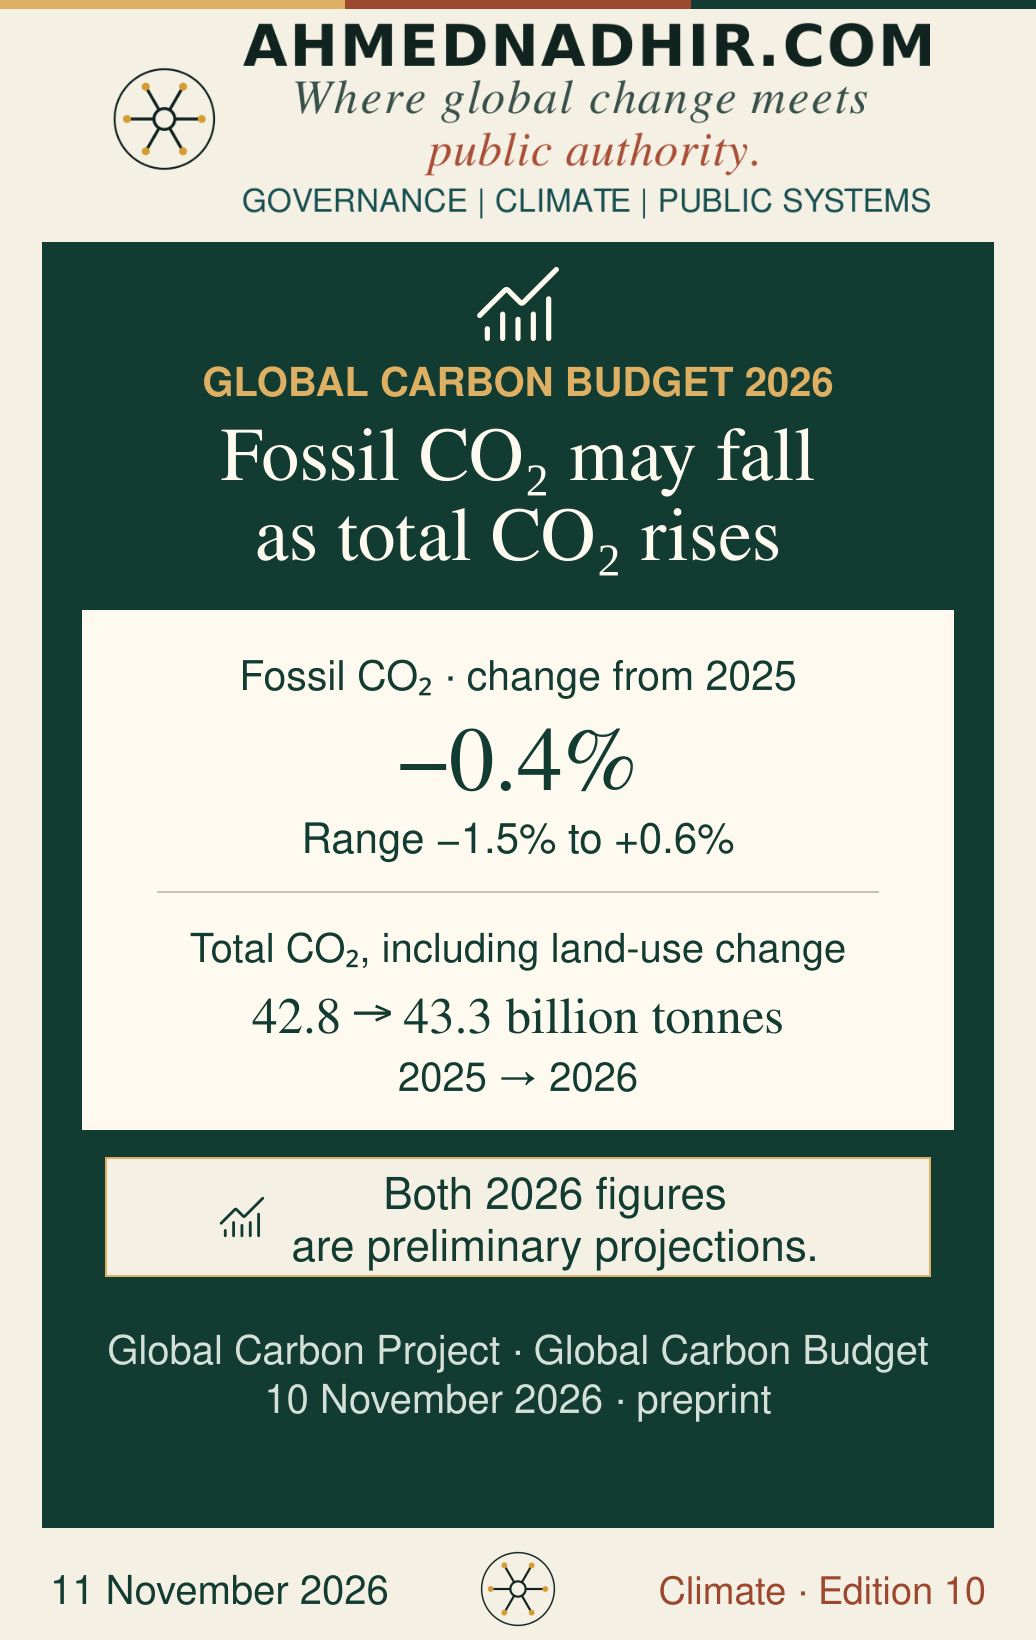
The Global Carbon Project’s 10 November budget projects fossil CO₂ emissions of 38.2 billion tonnes in 2026, a 0.4% fall from 2025. Its uncertainty range runs from a 1.5% decline to a 0.6% increase. With emissions from land-use change projected to rise, the combined total increases in the central estimate from 42.8 billion tonnes in 2025 to 43.3 billion in 2026. The 2026 values remain projections in the budget released for discussion. [3]
The preliminary range for fossil emissions spans a fall and a rise. The central estimate for total CO₂ includes land-use change.
A fall in oil emissions accounts for much of the projected movement in fossil fuels. The researchers point to the energy shock associated with the Iran conflict and disruption around the Strait of Hormuz. Solar and wind generation and electric vehicles also absorbed part of growing energy demand. Supply disruption can suppress consumption for a time. A shift in equipment, generation or transport infrastructure can keep changing it after prices settle.
These mechanisms have different consequences for an energy ministry considering a change to its investment plans. Lower oil use during a supply shock can coexist with higher costs for households and firms. Expanded electricity generation can displace fuel use for years, depending on the grid and the demand it serves. Data on the fleet, generation mix and fuel use across several years would help establish which change was taking hold.
The wider account brings land authorities and agricultural policy into the same national discussion. Even where the fossil figure improves, losses from forests and peatlands can move the total in the other direction. The Global Carbon Budget reports considerable uncertainty around land-use emissions. Keeping the two accounts visible lets readers see both the change and how much confidence to place in its components. A ministry that attributes a change to its own policy needs to show what happened within the sector it influences, alongside conditions such as fuel prices and weather that can also move the annual figures.
California forest and geological storage models Lee and colleagues · Nature Climate Change 6 November 2026
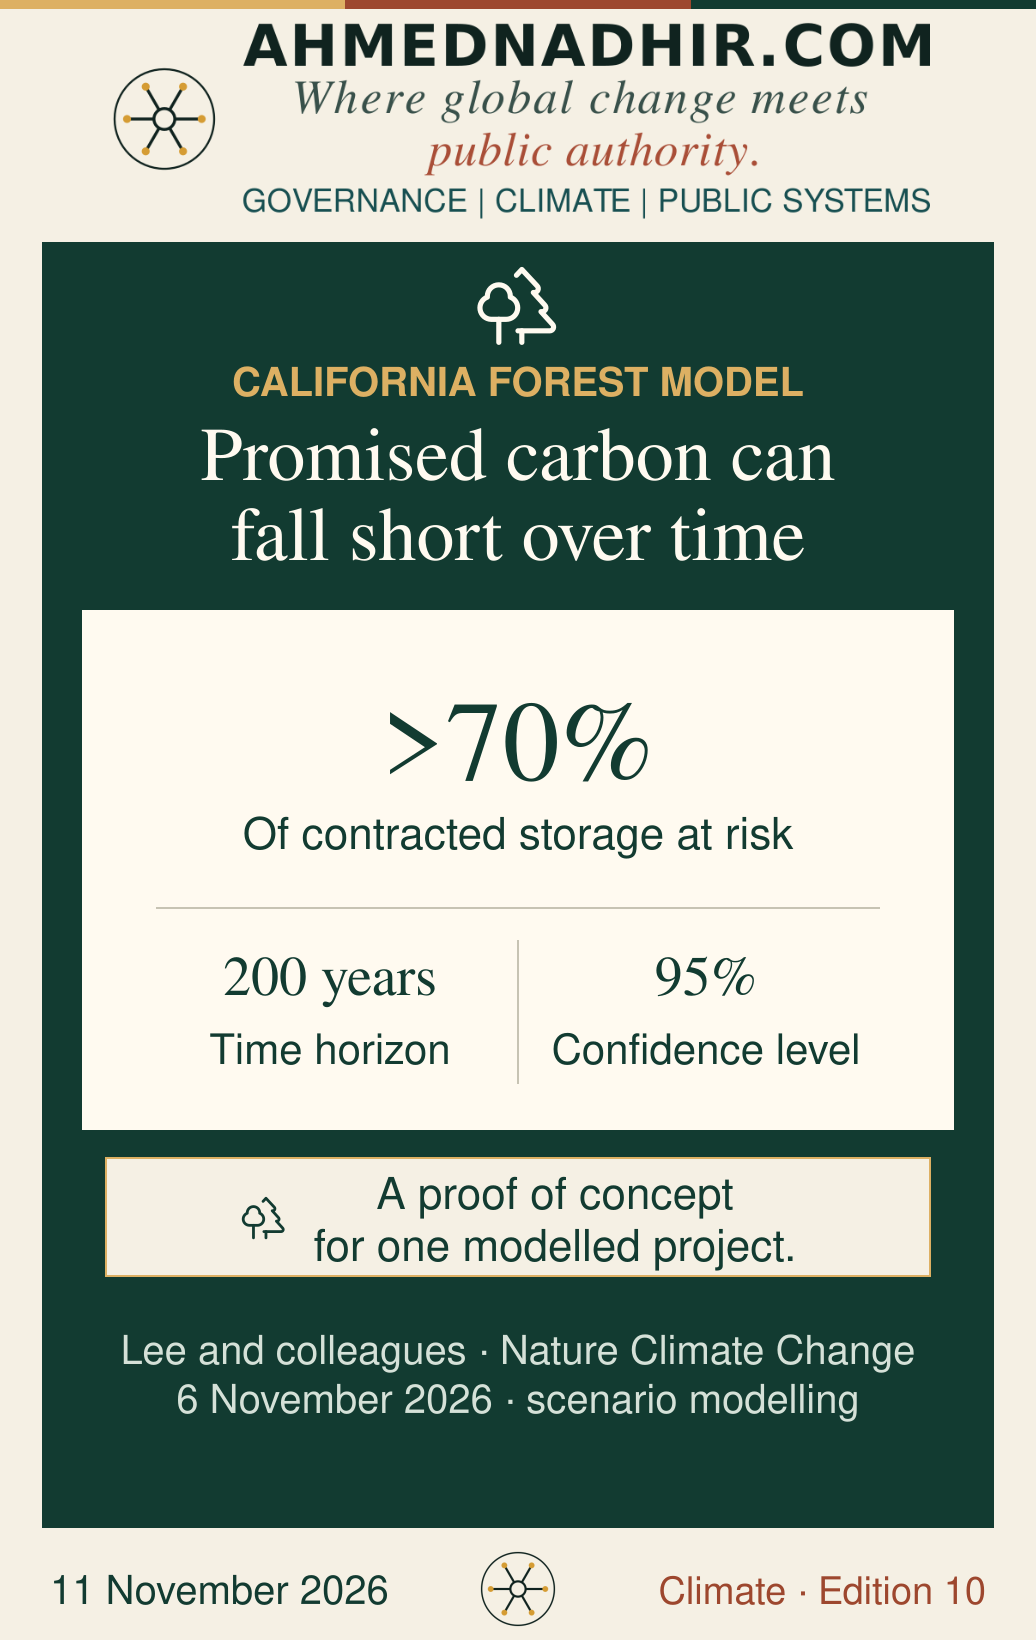
Bali Lee and colleagues proposed a measure called carbon at risk in Nature Climate Change on 6 November. It estimates how far the quantity of carbon still stored could fall short of a contracted removal at a chosen time horizon and confidence level. The researchers illustrate the method with models of forest fire and leakage from geological storage. In their California forest example, the modelled shortfall at the 95% confidence level exceeds 70% of contracted storage over a 200-year horizon. [4]
A forest-storage example illustrates how the specified period, confidence level and assumptions affect the estimated shortfall.
That is a result for a modelled project under stated assumptions. It describes a point near the adverse end of a simulated distribution. The expected loss, the chance of a fire and the amount of carbon that might be released in a fire answer different questions. The paper shows how changing modelling assumptions can substantially alter the estimated shortfall. A figure intended for procurement therefore has to travel with the assumptions that produced it.
The contract determines what happens when storage falls short. A buyer can ask how much would remain at the end of a given period, how it would be measured and who would supply replacement units. A seller may be willing to accept the obligation during a contract term. A regulator or pooled reserve may carry some risk over a longer period, where the arrangements provide for it. The credibility of any such promise depends on the funds and authority behind it when a loss occurs.
Pooling projects may reduce exposure to a failure at one site. Exposure can remain concentrated when several projects share the same fire conditions, operator or monitoring system. Two bids offering the same number of tonnes can therefore leave very different obligations with the buyer. The method gives a way to examine those obligations before price and volume are treated as a sufficient basis for choosing.
A satellite service needs an institution to run it
Africa, Asia and Latin America · 2005–2025 Deval and colleagues · Communications Sustainability 9 November 2026
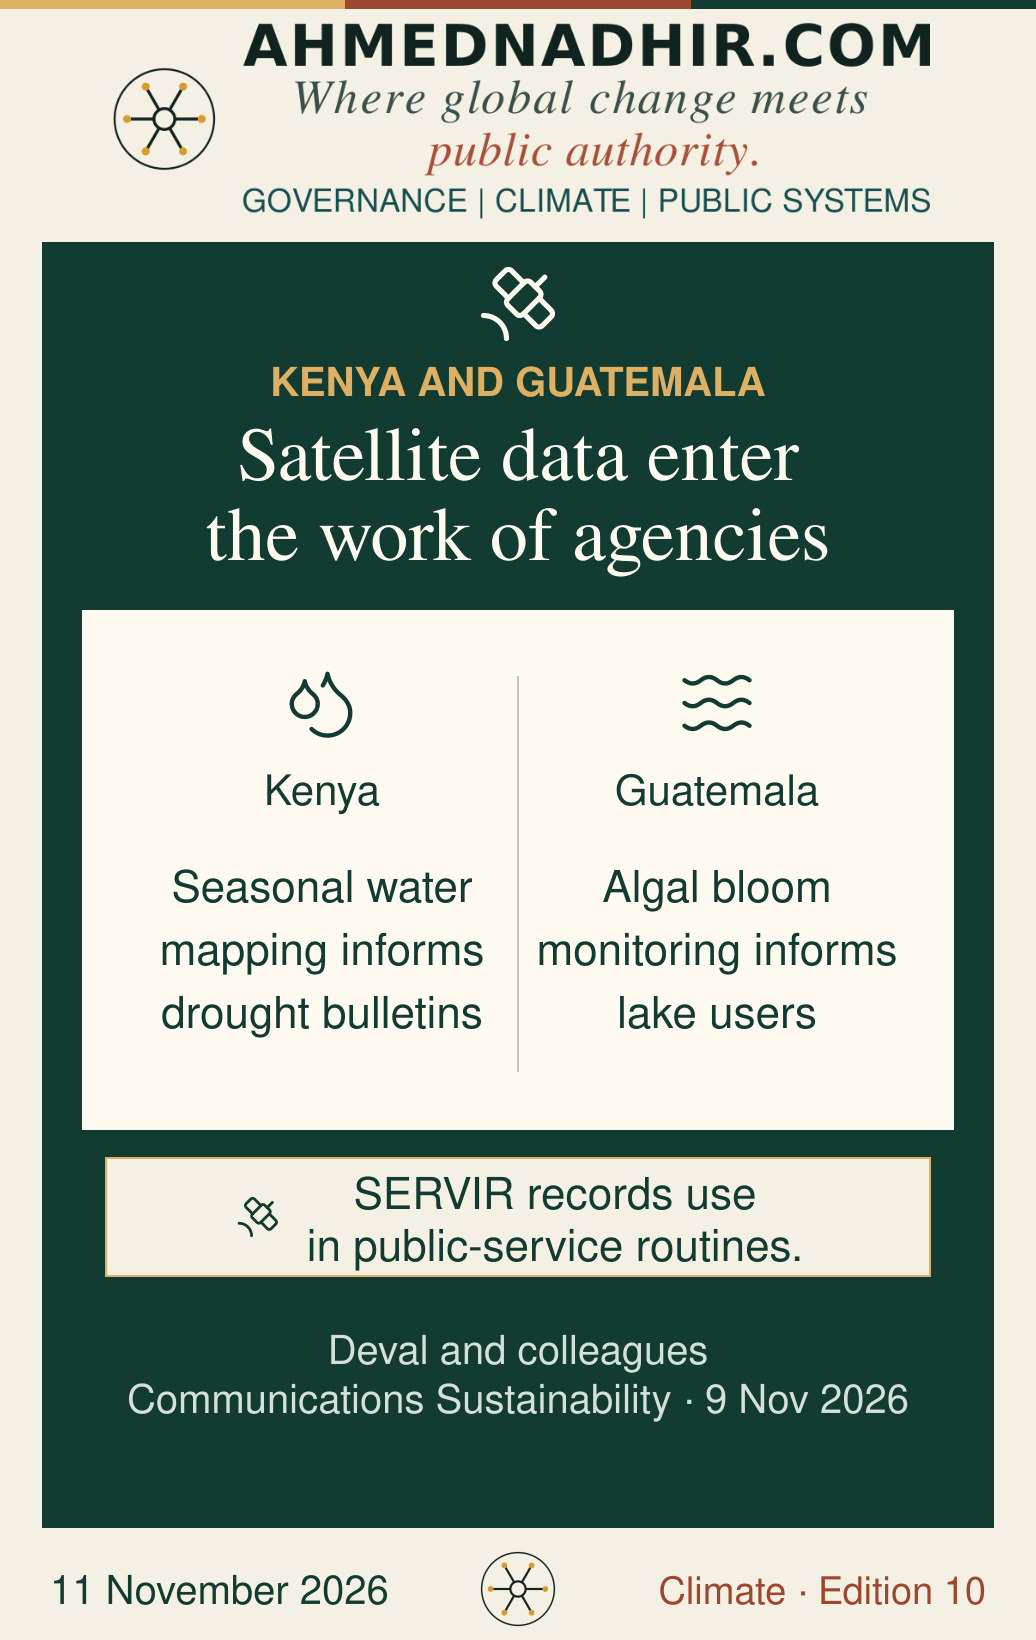
Chinmay Deval and colleagues looked back at twenty years of the SERVIR initiative in Communications Sustainability on 9 November. The initiative linked the United States National Aeronautics and Space Administration and the United States Agency for International Development with regional institutions across Africa, Asia and Latin America from 2005 to 2025. The authors examine how co-designed services entered the working routines of agencies responsible for water and resilience. [5]
Two SERVIR cases show how agencies used satellite observations in drought bulletins and public communications.
In Kenya, the authors describe satellite-assisted mapping of seasonal water availability that fed into National Drought Management Authority bulletins and coordination meetings. In Guatemala, work around Lake Atitlán used satellite observations to help identify algal blooms. The lake authority brought the service into its public communications. The two cases concern different decisions. One helps agencies follow changing water access in pastoral areas. The other helps a lake authority communicate a developing hazard to users.
The institutional work is visible in the steps between an observation and a decision. An agency has to establish what its staff will look for, how often they will review the result and where field observations are needed. It needs people who can explain errors and software changes to the staff issuing the bulletin. Once a donor-funded project ends, these duties become recurring work for the institution that accepted them.
The perspective draws on programme experience and examples of uptake. Some prototypes did not enter sustained use, and the examples do not measure an overall reduction in losses. A ministry assessing a new service would learn more from records of decisions influenced, checks made and maintenance paid for than from the number of dashboards launched. Continued use after the original funding ends is evidence about institutional capacity in its own right.
Consider the water authority’s decision again. Regional warming gives it reason to reopen the assumptions in the investment plan. The health report helps it see what may be gained if a more reliable supply reaches the people who need it. The record of satellite services shows how it might use new observations in a maintenance or allocation routine. Each step brings a different body of evidence to the same institution. The choice still depends on the local service and on who can act when it comes under pressure.
The carbon readings bring the same discipline to a different kind of account. A year’s change in fossil emissions carries one meaning when oil demand has been suppressed by a shock and another when demand has shifted to a durable substitute. A purchased removal means more when its storage period and remedies can be stated and financed. In both cases, the conditions that hold after the headline figure was produced determine how much the decision can rely on it.
For a public authority, the test is whether the evidence lets it explain a decision to the people who will live with its consequences. A water scheme can be assessed by continuity of supply where interruptions are costly. A warning can be assessed by what recipients could do in the time it gave them. A removal purchase can be assessed against the storage it secures and the liability it leaves. Those are claims that can be revisited after the budget is spent, the season ends or the supplier has gone.
Sources and notes
The five publications appeared between 4 and 10 November 2026. Their underlying observations and projections span different periods, as indicated in the readings. The discussion of the two Nature Climate Change studies draws on their publishers’ abstracts and available article excerpts. The applications to spending, procurement and public services are this edition’s analysis.