
Climate resilience and adaptation finance
Developing countries · International public finance
Climate protection and the limits of private finance
Report launched: 4 November 2026. Finance flows: 2024; projected needs: 2035.
A drainage network can protect homes, roads and businesses whose owners never make a payment to the operator. The resulting social value can be much larger than the income available to finance the asset. That distinction helps explain why a large adaptation need does not automatically become a large market for investment.
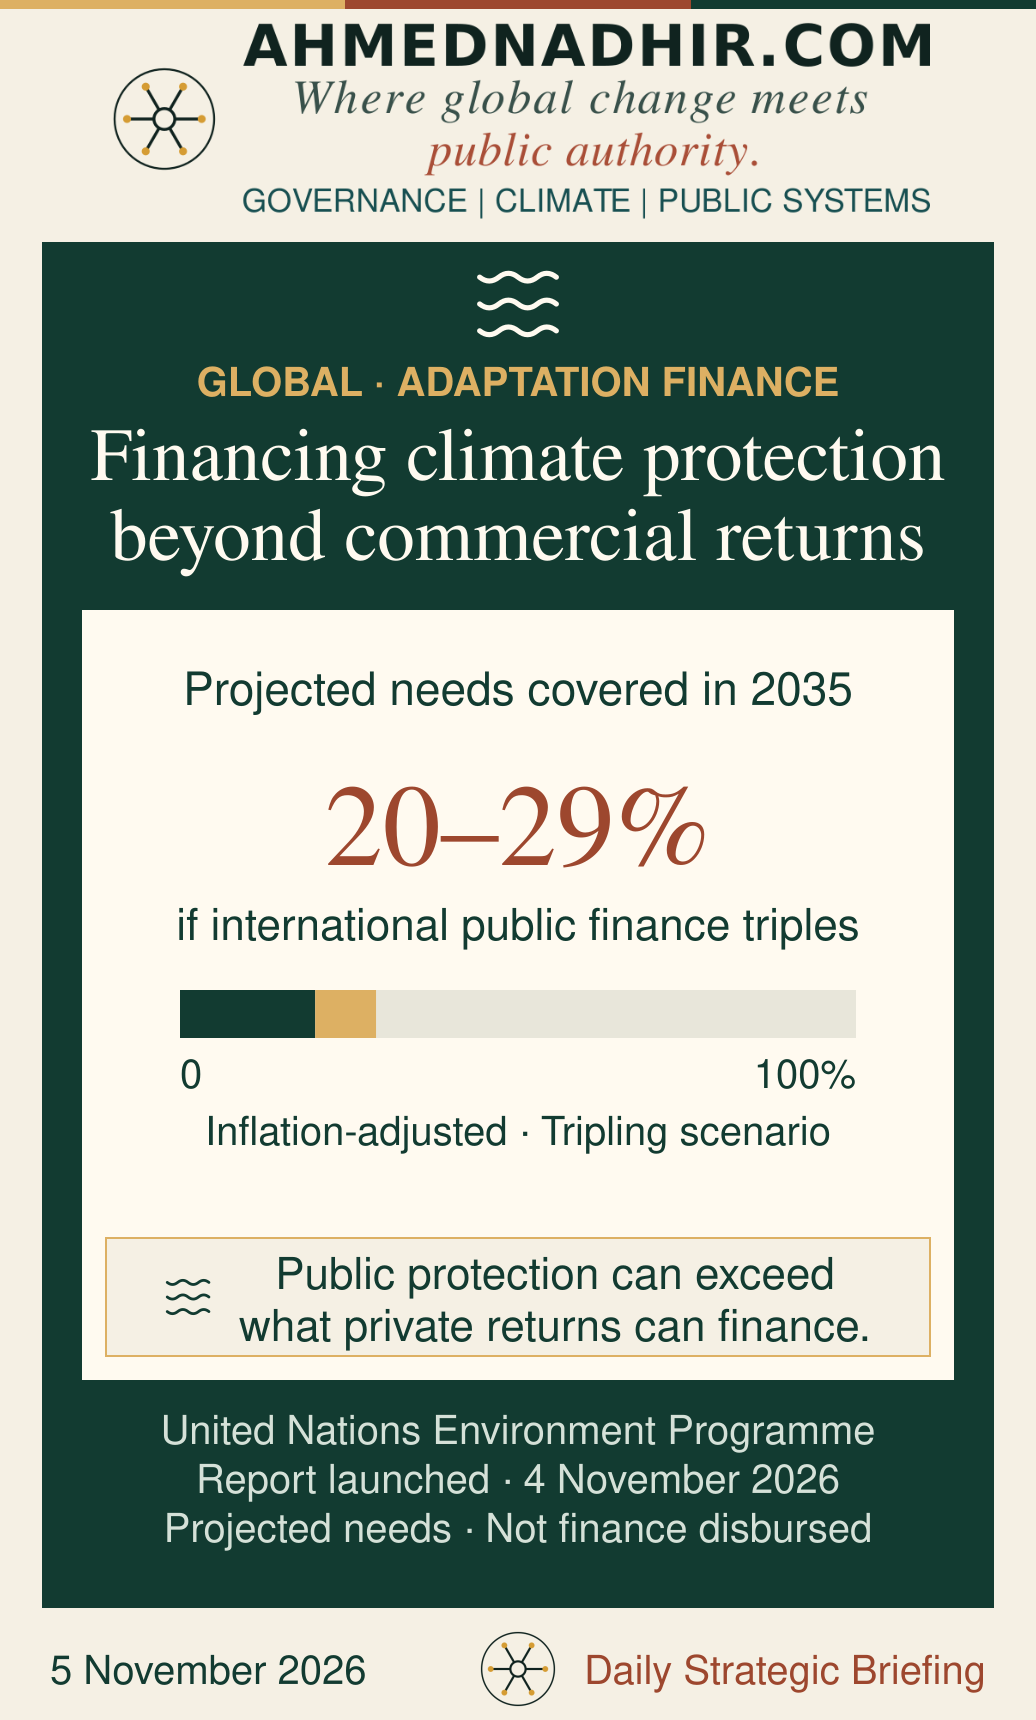
The United Nations Environment Programme (UNEP) puts developing countries’ adaptation needs at about US$305 billion annually by 2035. Its report, released on 4 November, records US$28.2–31.7 billion in international public adaptation finance in 2024. Even tripling such flows by 2035 would meet only 20–29% of estimated needs after inflation. The estimate largely excludes the private sector’s own requirements.
The financing instruments address different interests. A firm can have a commercial reason to protect its own premises, while a wider drainage system serves people and assets beyond its balance sheet. UNEP reports growing private flows, much of which concern the private sector’s own adaptation or would ultimately be paid for by developing countries. Private participation therefore changes the financing arrangement without necessarily transferring the final cost away from exposed people and governments.
Governance, enterprise and public finance
Kenya · Business costs and economic reform
Kenya’s digital reforms still depend on decisions behind the screen
Kenya Economic Update released: 4 November 2026. Reform scenarios run to 2035.
Kenya’s governance problem illustrates a different way public decisions can increase private costs. An official fee is visible. The cost of repeated visits, an unpredictable inspection or a connection that remains unresolved can be harder to record. Those burdens affect the feasibility of a small investment even when they do not appear as additional public expenditure.
The World Bank’s Kenya Economic Update, released on 4 November, links governance weaknesses with public finances, electricity and logistics costs, and firms’ dealings with public institutions. It describes uneven gains from digitisation where manual workarounds and discretionary procedures remain. The distinction is material: an online application can change the interface while leaving control over the consequential decision elsewhere.
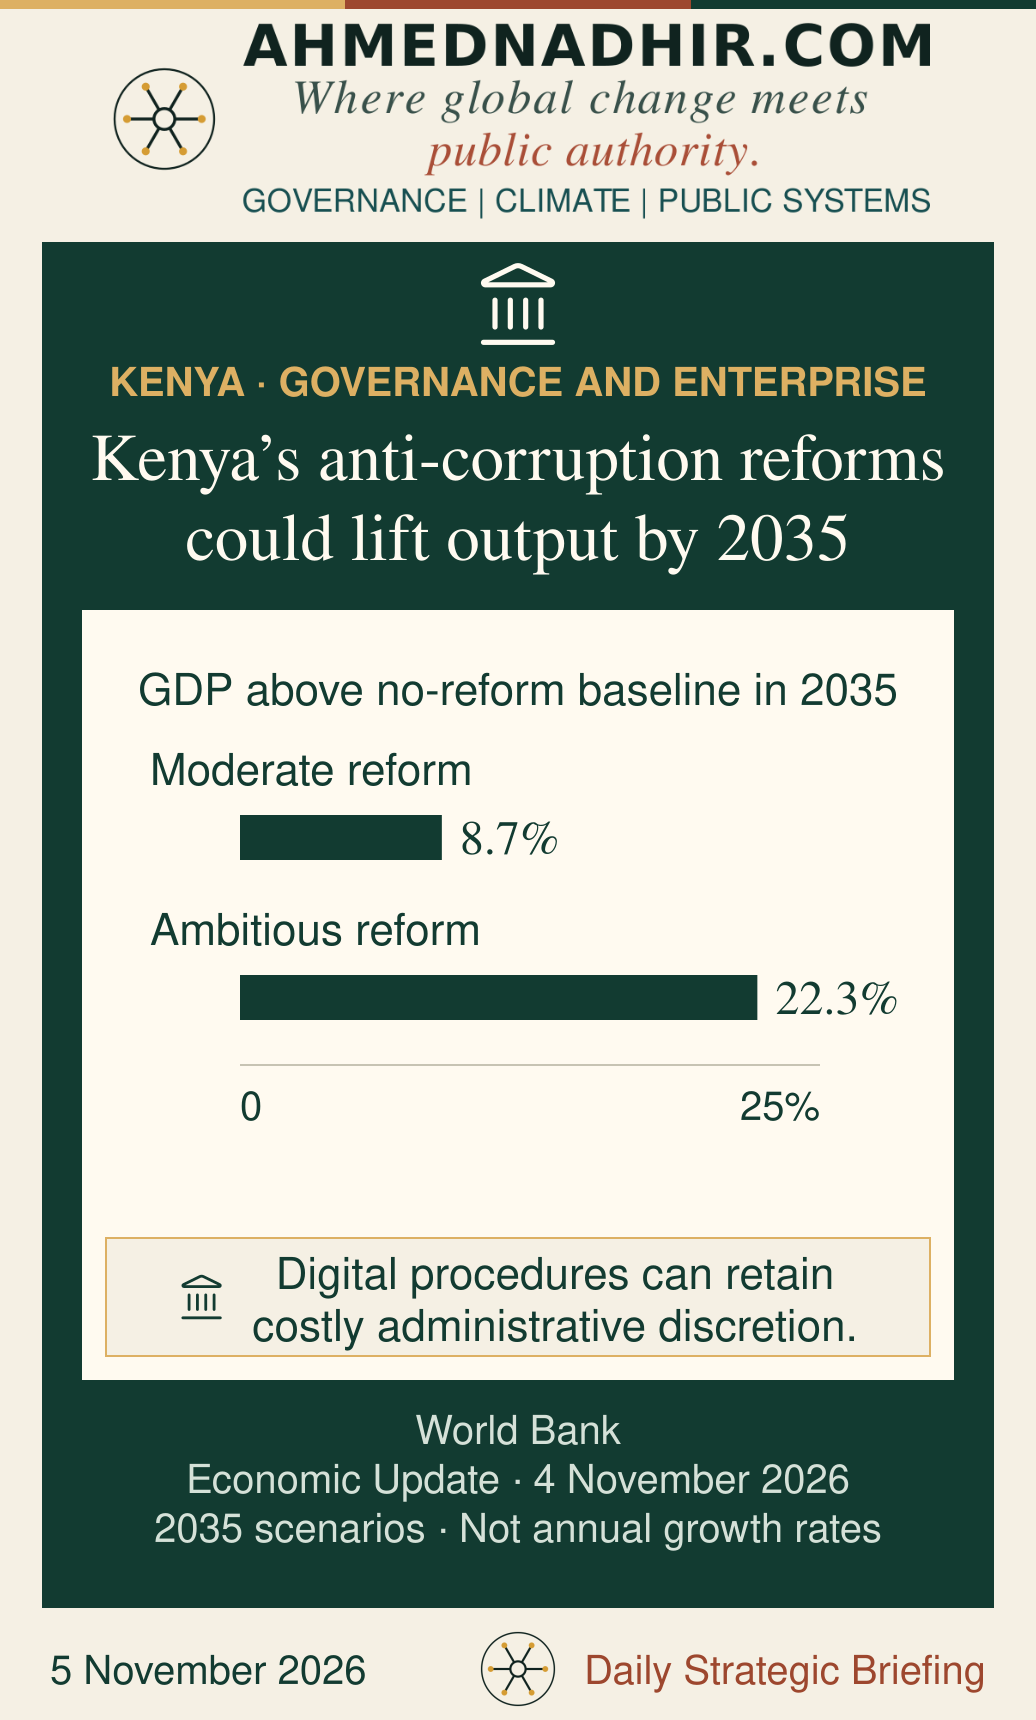
The report models substantial potential gains from anti-corruption reform. Moderate improvements leave gross domestic product (GDP) 8.7% higher in 2035 than under a no-reform scenario; ambitious improvements produce a 22.3% difference. These conditional output levels are not annual growth forecasts. They illustrate the possible cumulative value of reform, without proving the effect of a particular platform or administrative change.
Buildings, energy and public infrastructure
Global building stock · National standards and investment
The cheapest building can carry the larger lifetime bill
Report and announcement: 5 November 2026. Pathway compares 2035 with 2025.
A building fixes part of its occupants’ future expenditure long before the first energy bill arrives. Design, equipment and construction quality influence the cost of keeping it usable. Where the organisation purchasing the asset is different from the people paying to operate it, the saving recognised at acquisition can sit beside a burden that emerges elsewhere.
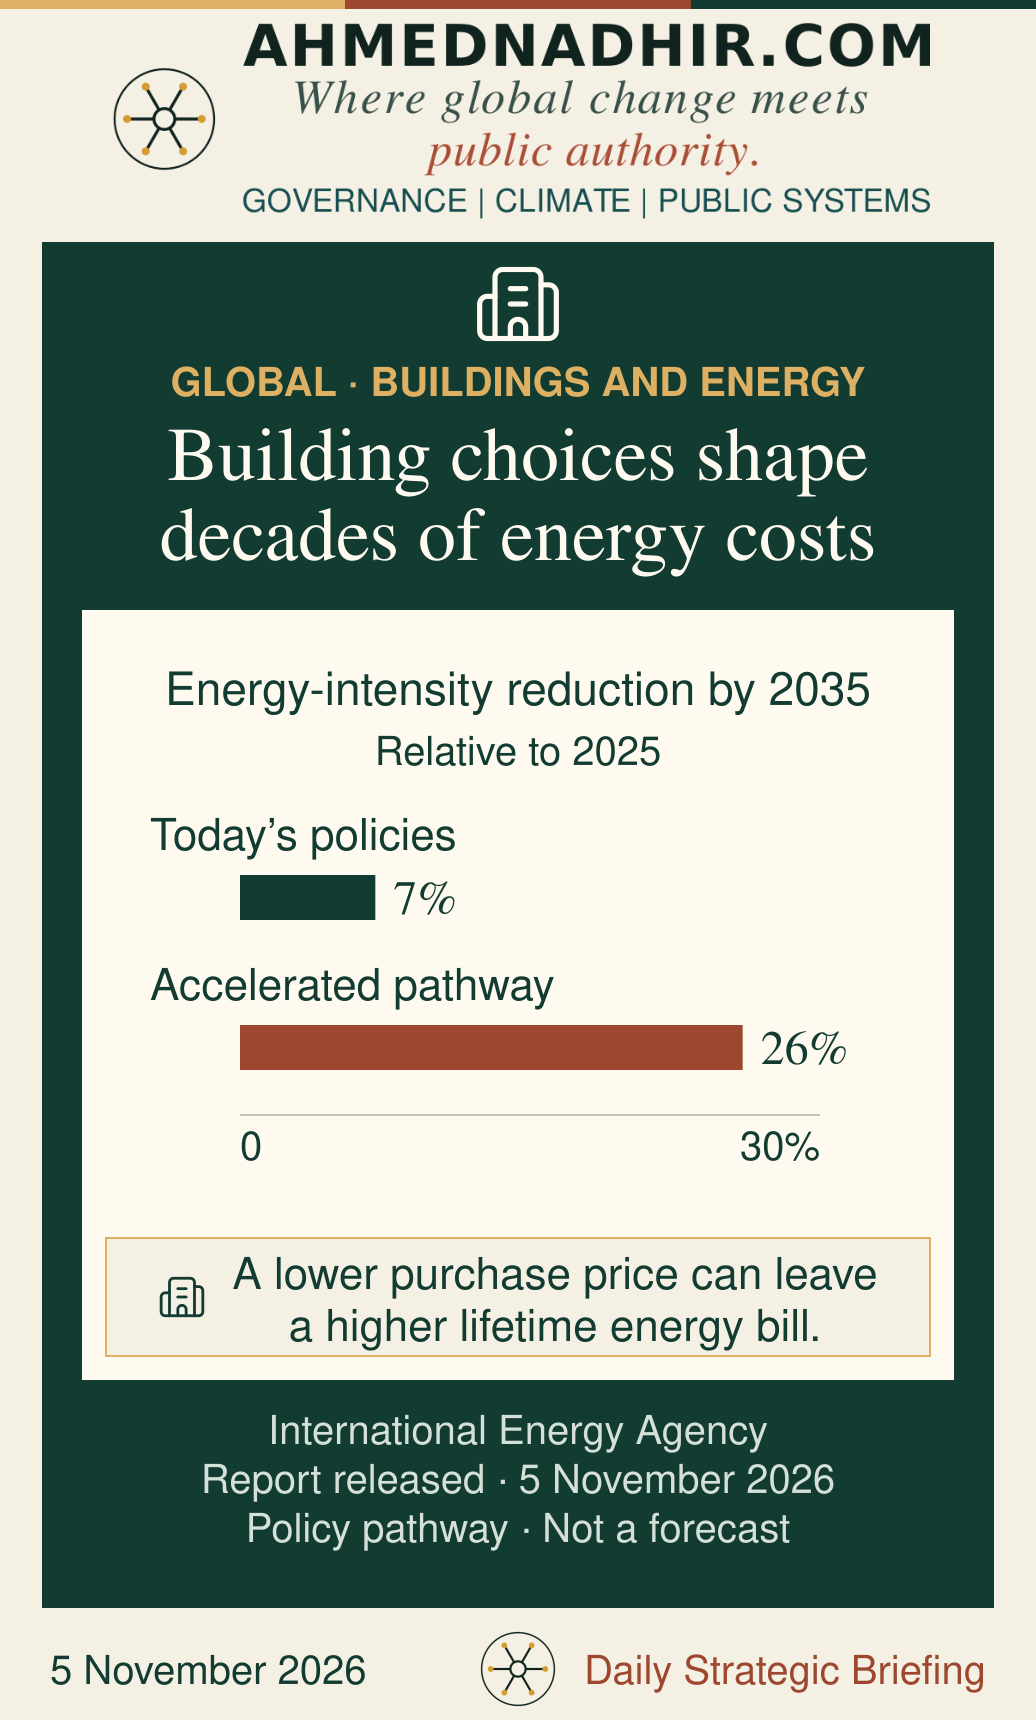
The International Energy Agency (IEA), in its assessment published on 5 November, compares a 7% reduction in global buildings energy intensity by 2035 under today’s policy settings with 26% under an accelerated pathway, both relative to 2025. The pathway combines efficient equipment, improved building envelopes, electrification and access to clean cooking. It is a scenario, rather than a forecast or an adopted global requirement.
The proposed at-least-25% objective concerns energy intensity, not an identical reduction in total consumption or in every household’s bill. The distinction matters as demand for energy services grows. The report also stresses different national starting points: the appropriate combination of equipment, construction and energy access cannot be read directly from a global percentage.