
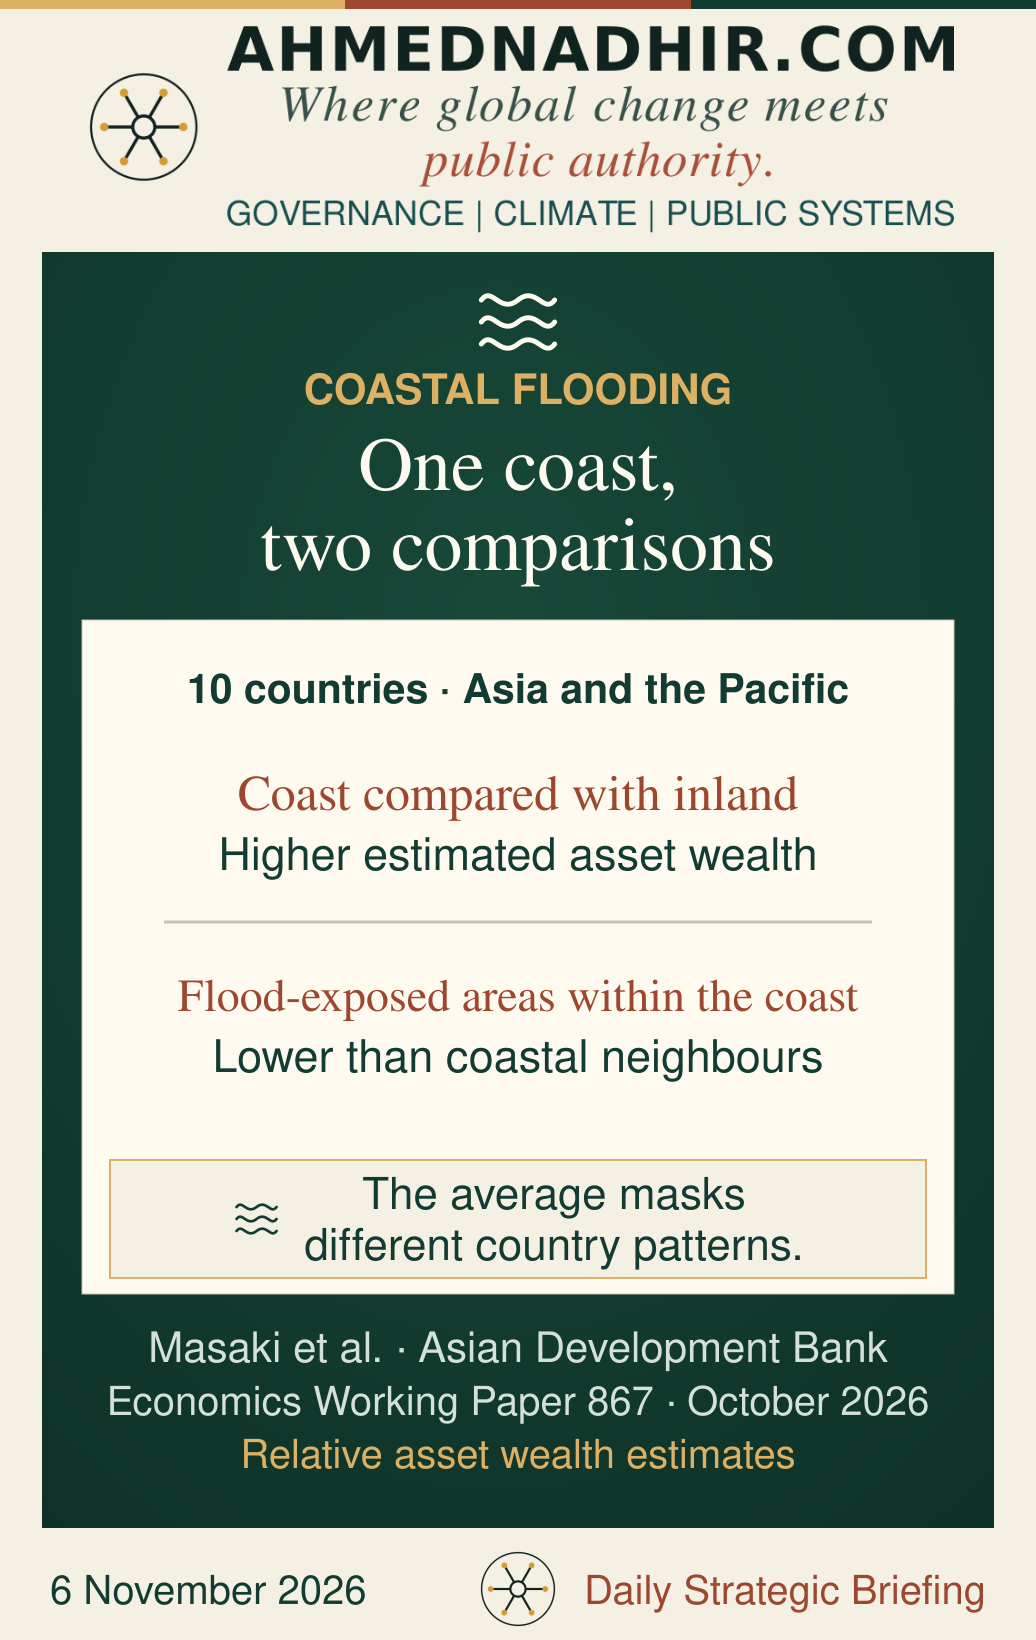
A coastline can look prosperous on a national map and still contain some of the households least able to survive a flood. An October working paper covering ten countries in Asia and the Pacific finds precisely this reversal. Coastal areas generally scored higher on an index of asset wealth than inland areas. Within the coastal zone, however, people in areas exposed to flooding tended to score lower than their coastal neighbours. For a ministry deciding where to spend, the national comparison describes the coast; the local comparison changes the decision. [1]
The distinction matters when a port, a power substation and a low-income settlement compete for the same protection budget. The port may be essential to the wider economy. The settlement may have little property value on the books and very little capacity to recover. A credible appraisal needs to keep both kinds of loss visible. The question is what the public budget would save, and for whom.
The map changes with the comparison
Takaaki Masaki and colleagues combined satellite-based estimates of relative asset wealth with coastal inundation maps for current conditions and two end-of-century climate scenarios. In Bangladesh, India and Myanmar, the overlap between exposure and lower estimated wealth persisted across the scenarios. In Indonesia, the association reversed under the high-emissions projection as the flood footprint reached wealthier areas. The Philippines also showed substantial exposure in relatively prosperous coastal areas. One regional average would obscure all three patterns. [1]
The paper measures where exposure and estimated wealth coincide. It does not measure what flooding does to household income. Its future maps hold the distribution of population, assets and coastal protection at their baseline, so they cannot tell a ministry where people will settle or how effective new defences will be. Their strongest use is to challenge an investment ranking: would the same projects come first under a different flood footprint, or if the appraisal counted interrupted services and barriers to recovery alongside damage to property? [1]
What the city plan leaves out
A study by Victoria Sinner and colleagues, published in the August 2026 issue of Urban Climate, examined 64 plans from 37 South American cities and urban agglomerations with more than a million residents. Informational and behavioural measures featured prominently. Public health adaptation and financial tools for sharing risk appeared less often. That is evidence about the contents of the plans. It cannot show whether a city’s health service was prepared, or whether actions described in a plan were funded or carried out. [2]
The finding changes how a city’s resilience plan can be read. A drainage project may protect houses while a flooded access road keeps the nearest clinic out of reach. A public warning may arrive in time while families have nowhere to go. The useful budget question is whether the agencies that keep roads, water and care available have assigned funds and responsibility for doing so. A count of projects in the climate plan cannot answer it. [2]
The households a register misses
An Asian Development Bank practice brief listed on 22 October draws on assessments undertaken in 2023 and 2024 by 40 grassroots women’s groups in Gunungkidul, Indonesia, and Kalaiya, Nepal. In Gunungkidul, participants identified older people living alone in remote places and households in informal debt after climate-related income shocks among those missed by existing programmes. In Kalaiya, the mapping pointed to weak irrigation and unreliable water access. These are local observations about water stress and programme delivery. They do not establish how common the same exclusions are on flood-prone coasts, or how much a revised programme would reduce losses. [3][4]
They do expose a weakness that a flood model cannot resolve. A hazard map can identify an exposed street; it cannot say which resident cannot leave without assistance. A national register can give an eligibility decision consistency; it may still lack a reliable way to add someone whose exposure has changed. Local verification is most useful when officials can act on it under published criteria, record their reasons and offer a route to correct omissions. It also takes a functioning road or water system to make some forms of household support useful. [3]
What the budget should make visible
A finance ministry can protect a strategic asset and reduce hardship in the same programme, provided it makes the two objectives explicit. For each investment, the appraisal can show the damage it would avert, the public services it would keep running and the households whose prospects of recovery it would improve. That makes a trade-off visible to the people who authorise the spending. A map can show where the water may go. The budget reveals whose losses the state has chosen to count.