
Overview
Food and power gains depend on operating costs and access
For a country buying much of its wheat abroad, climate pressure on distant harvests is also a concern for importers, millers and household budgets. For a power system adding renewable generation, the difficult hours can matter more than the annual average. For a family facing higher energy costs, a policy described as fair across income groups may still leave an unaffordable bill.
Research published from 7 to 13 October brings these questions into sharper focus. It examines compound crop losses, the returns and risks of wetland conversion, electricity supply during temperature extremes, the distribution of climate-policy costs and access to flood insurance. The evidence differs in method and strength. The argument running through these findings is that the benefit from a climate response depends on its operating conditions. Additional assets, hectares or financial products offer an incomplete account of resilience when water, energy, operating money or access remain constrained.
This also identifies opportunities. Better use of existing farmland, coordinated water and energy investment, flexible electricity demand, carefully targeted support and easier access to finance may offer value alongside new infrastructure. Their returns depend on local conditions and on the public decisions and private operating commitments behind them.
Food security and waterGlobal wheat production and Kenya
Heat and drought change the case for wheat irrigation
Luo and colleagues · Nature Food · 8 October 2026
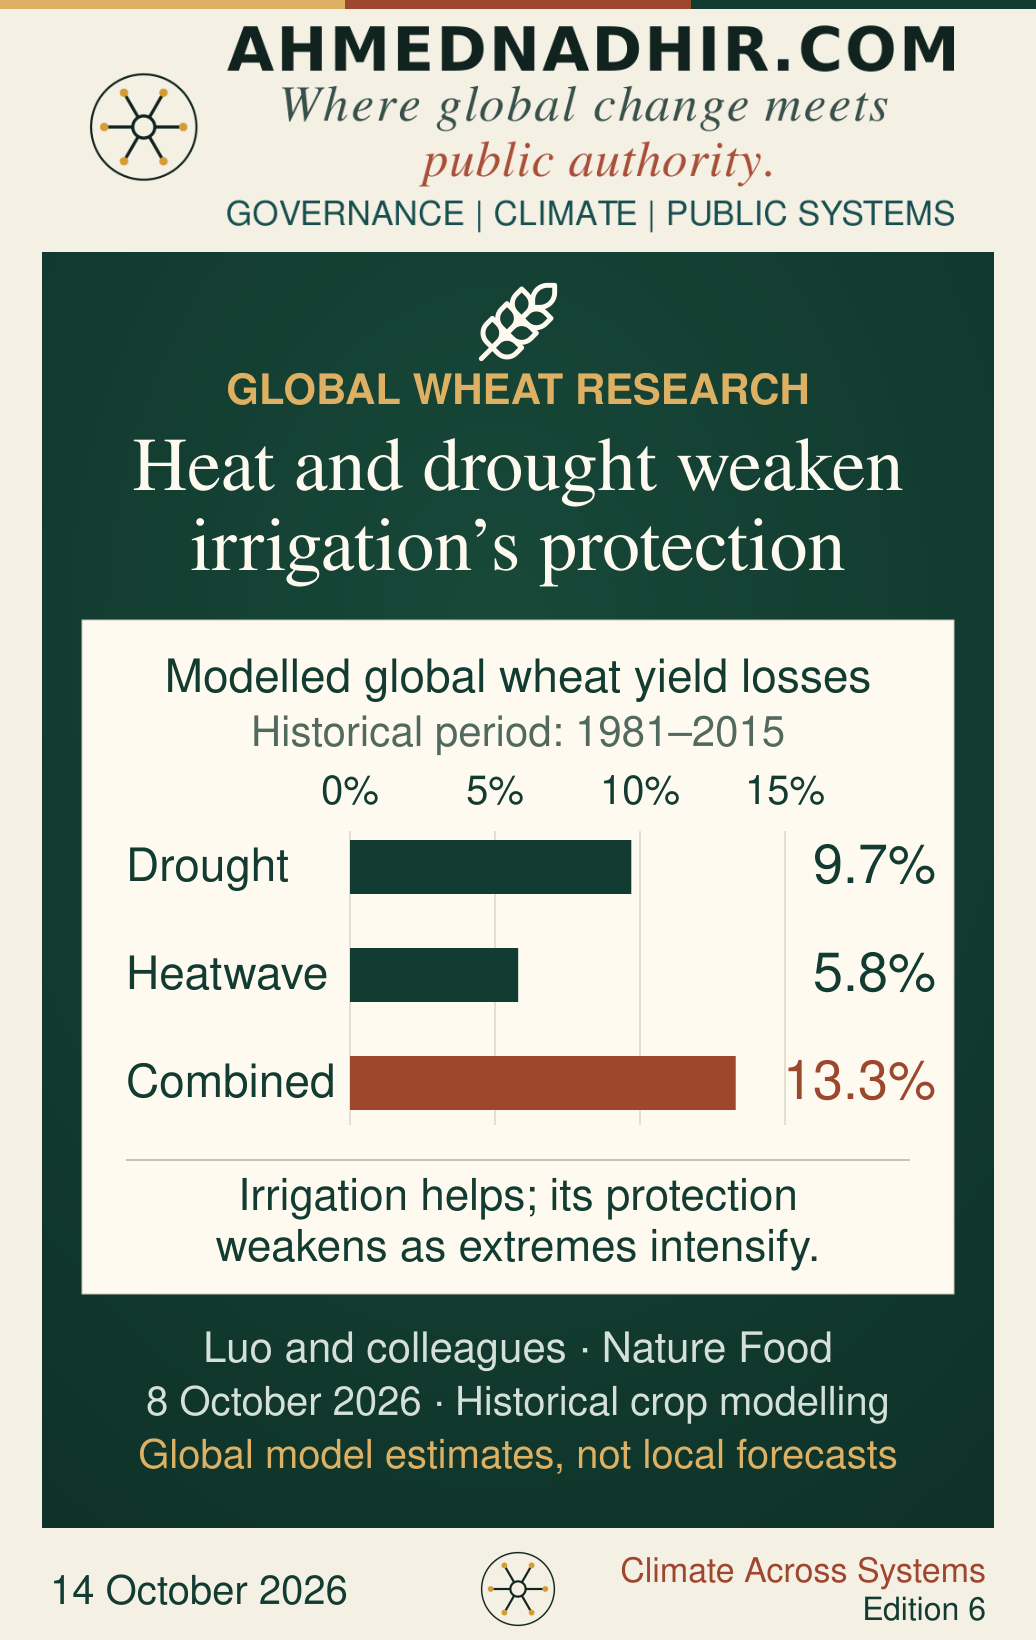
A refined global wheat model examines drought, heatwaves and their combination over 1981–2015. The authors report average modelled yield losses of 9.7, 5.8 and 13.3 per cent respectively. Irrigation reduces the damage in their analysis, but its protective effect weakens as extremes intensify. These are historical modelling results, not a forecast for the coming Kenyan harvest.
The domestic connection is substantial. The Kenya National Bureau of Statistics reports that imports supplied 89.8 per cent of Kenya’s wheat supply in 2025. That is a supply share, not the share of every household’s food bill. It establishes why assessment of overseas crop risk belongs alongside domestic production policy. It does not establish a price increase this week.
Irrigation sits within two distinct food-security choices. At farm level, its return depends on the additional yield a water supply can support relative to other crop and management options during difficult seasons. At national level, domestic production, supplier diversification, storage and purchasing arrangements address different risks to availability and cost. Import diversification can reduce dependence on one origin, but it cannot remove a shock affecting several producers.
Water and power change the farm calculation together. A pump can make water available while adding electricity costs; a loan can finance equipment while requiring repayment through a poor season. The return turns partly on which constraint the investment actually relaxes. Kenya’s Water Resources Authority regulates abstractions and allocation, including protection of basic human needs and the environment. Developers, farmers and lenders control different parts of the investment and operating decision.
Land use and agricultural investmentGlobal evidence with Kenyan application
New wetland cropland brings high flood exposure
Zhang and colleagues · Nature Sustainability · 9 October 2026
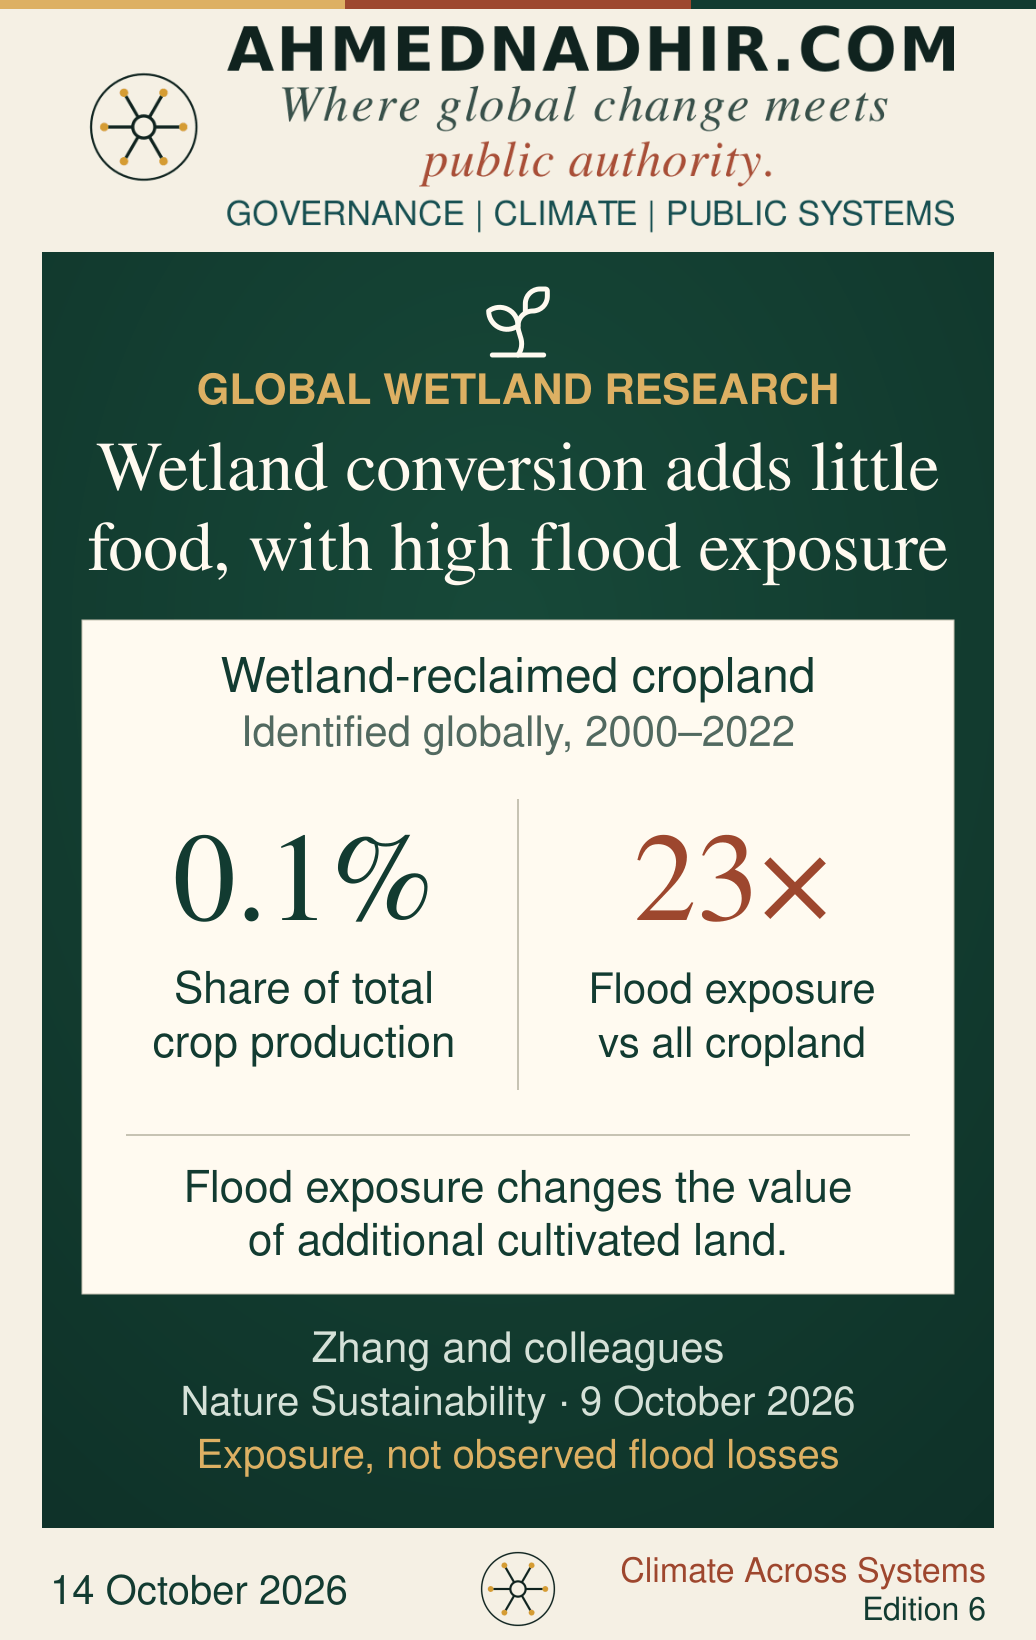
A global assessment identifies cropland reclaimed from wetlands during 2000–2022 and compares production and flood exposure. Nearly half had lower yields than existing croplands. Its authors estimate that this land contributed 0.1 per cent of total crop production, while its average flood-exposure probability was 23 times that of all croplands. The figures concern this identified class of converted land, not agriculture as a whole.
The finding changes the comparison behind agricultural expansion. Converting a wetland may add hectares without adding much dependable food. It can also place crops and associated investment in a highly exposed location. The global result does not establish that every converted parcel performs poorly, or settle the case for an individual Kenyan proposal.
The wheat and wetland studies address different responses to pressure on food supply. The first tests crop performance under extremes. The second questions where production is expanded. Together they strengthen the case for gains on existing farms as an alternative to opening new land. The balance depends on yield potential, water, access, tenure and livelihoods. Land classified as uncultivated may already support people whose uses and interests are absent from a production map.
Kenya already has a relevant public decision route. The National Environment Management Authority explains that activities likely to harm wetland management require environmental assessment under the applicable regulations, and that sustainable wetland use belongs in land-use planning. The research can inform the evidence requested through that process. It does not replace statutory assessment or establish an automatic prohibition.
For investors and lenders, flood exposure and operating costs can erode the return from additional output. Gains on existing farmland may carry a different balance of production, finance and livelihood effects.
Electricity and public healthUnited States evidence and South African procurement
A cleaner power mix can hide fossil dependence at the peak
Zhong and colleagues · npj Climate and Atmospheric Science · 7 October 2026
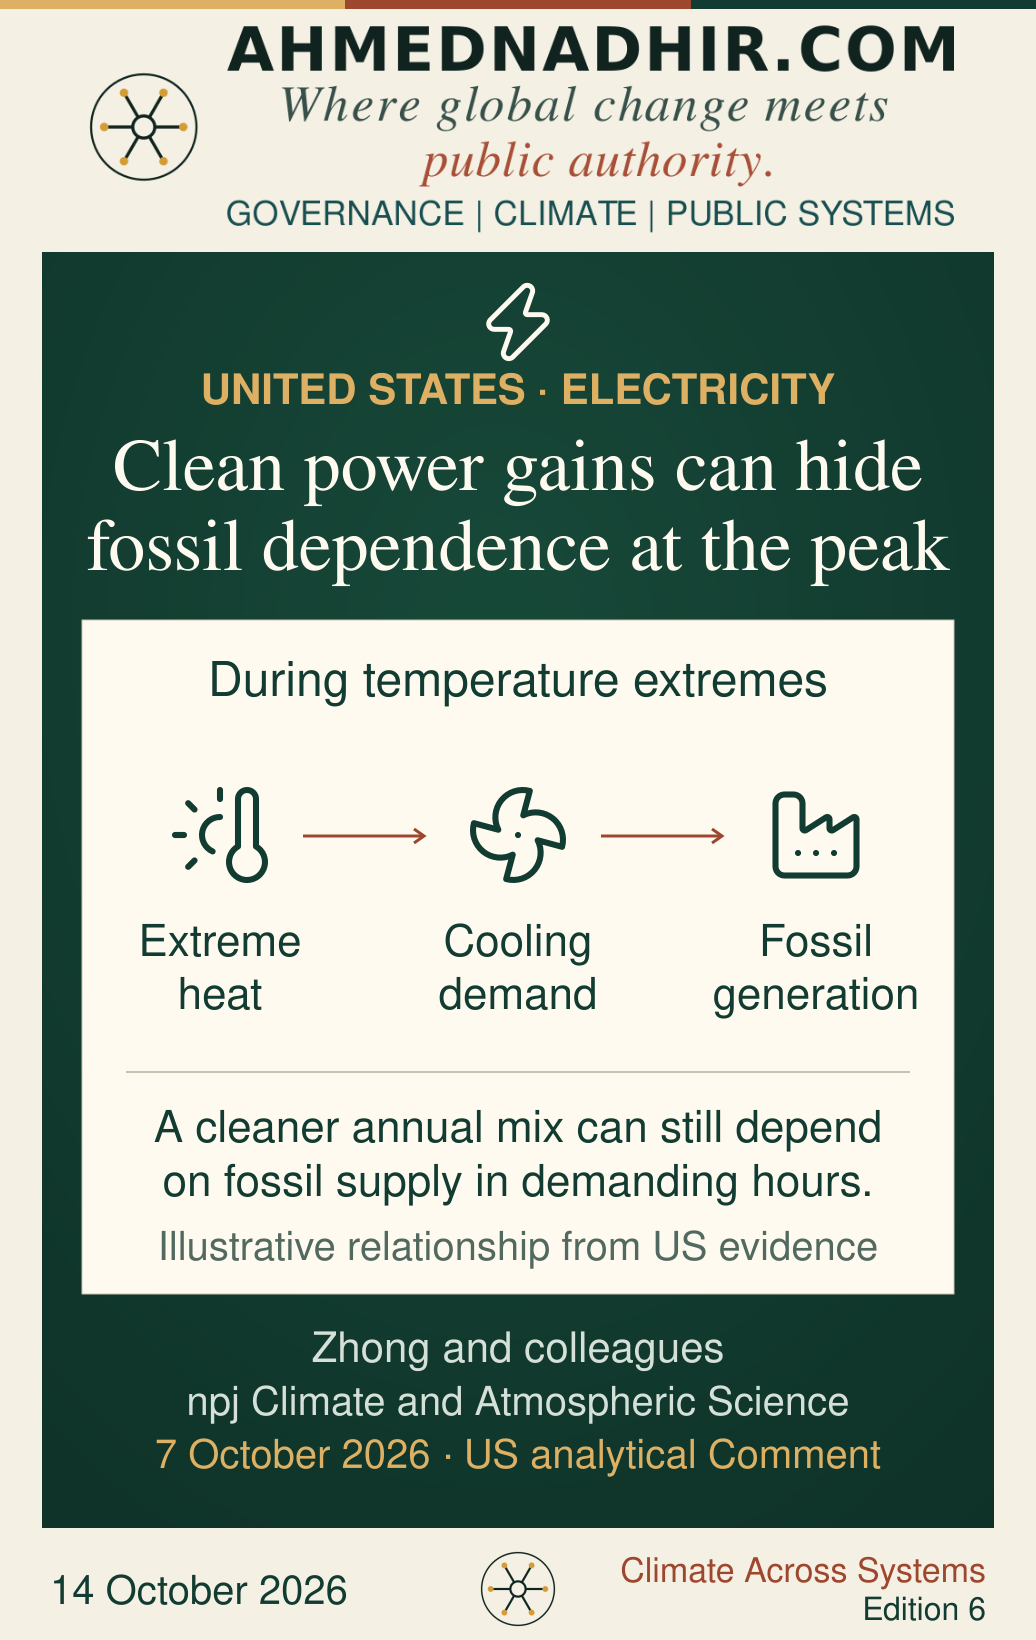
An analysis published as a Comment uses United States power-system, temperature and emissions data to examine electricity during extreme weather. The authors find increased fossil generation during temperature extremes, including systems with low annual fossil shares. Their argument is that the annual generation mix can conceal dependence on thermal power during demanding periods. The article is an analytical Comment, not a trial of competing procurement options.
Cooling protects people from heat while increasing electricity demand. The supply response affects emissions, air quality and cost. Efficient buildings and equipment, flexible loads, storage and networks can contribute different services.
South Africa supplied a concrete policy decision on the same date. Electricity Minister Kgosientsho Ramokgopa proposed prioritising 4,600 megawatts of battery storage and 5,000 megawatts of gas-to-power under the first section 34 determination associated with the Integrated Resource Plan 2025. These are proposed capacities, not completed plants. The two technologies cannot be assessed as though they provide an identical service.
Storage shifts electricity between hours and has a finite discharge duration. Gas supplies additional power and requires fuel. Standby capacity can provide valuable insurance against disruption, but its payment and fuel obligations affect future bills. The relative value changes with the operating conditions.
For Kenya, the institutional connection is specific. The Energy and Petroleum Regulatory Authority sets and reviews tariffs and approves relevant power-purchase and network-service arrangements. Those decisions connect a reliability service with developer obligations and consumer costs. A national annual renewable share alone cannot settle the commercial or operational value of a particular contract.
Climate policy and household budgetsEuropean Union comparative research
Climate policy can look fair while costs remain unequal
Vandyck and colleagues · Nature Climate Change · 13 October 2026
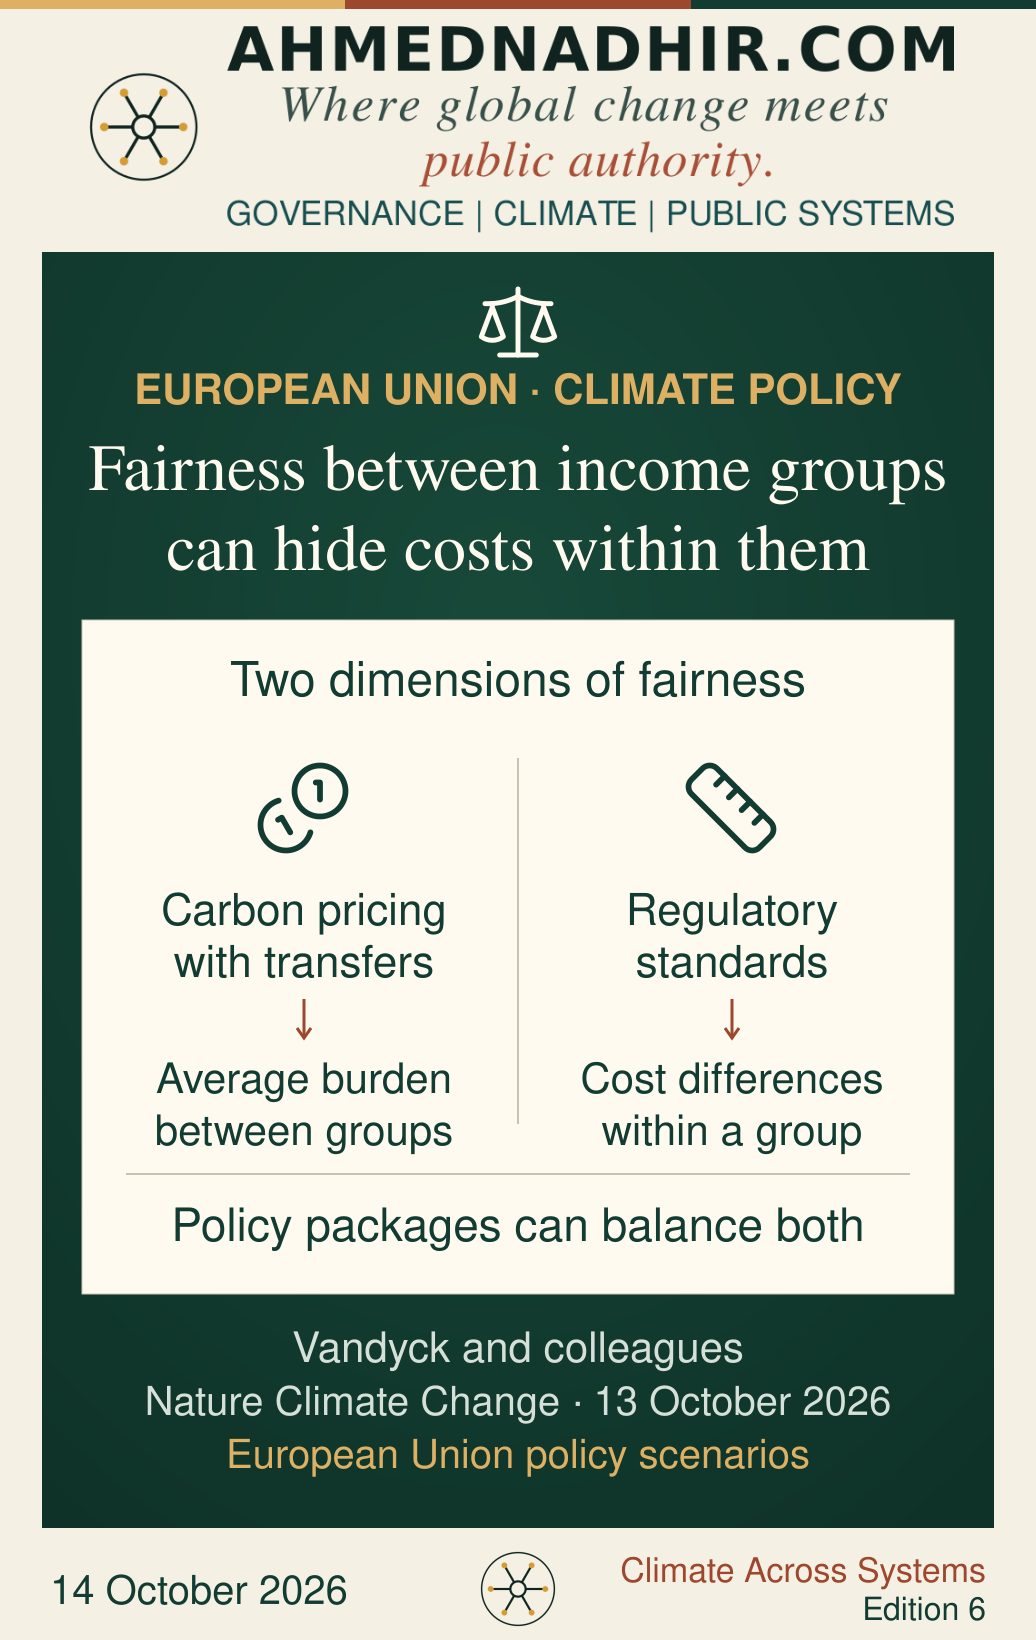
A European Union (EU) modelling study compares climate-policy packages combining prices, standards, subsidies and transfers. It distinguishes distribution between income groups from differences among households with similar incomes. The authors find that carbon pricing with recycled revenue can offset regressive average effects, while standards reduce variation within income groups. In their model, combining instruments can balance these objectives more effectively.
The distinction helps explain what a household average leaves out. Two families with similar incomes may face different transport needs, housing conditions or opportunities to change equipment. A payment based only on income may therefore leave very different costs after support. These examples illustrate the policy-design problem; the study does not measure their prevalence in Kenya.
The public choice extends beyond the amount of compensation. A price signal may encourage lower energy use without making an affordable alternative available immediately. Standards can improve products or buildings but require compliance spending. Subsidies can help finance a change, while reaching households differently according to eligibility, ownership or the capacity to apply. These interactions shape the burden remaining after support.
For public finance, a subsidy and a transfer have different purposes. One can help change an asset or activity; the other can support a household’s current budget. Financing, timing and administration affect what each delivers. Regulators and sector authorities also control standards that a finance ministry cannot deliver through payments alone. Businesses make the equipment, lending and service decisions that determine whether households can use the support.
The EU results provide a method for local appraisal, rather than a package to copy. Modelled welfare effects do not prove how voters will respond.
Insurance access and public institutionsUnited States Tribal nations
Flood insurance can exist while access remains difficult
Kraft and colleagues · npj Environmental Social Sciences · 7 October 2026
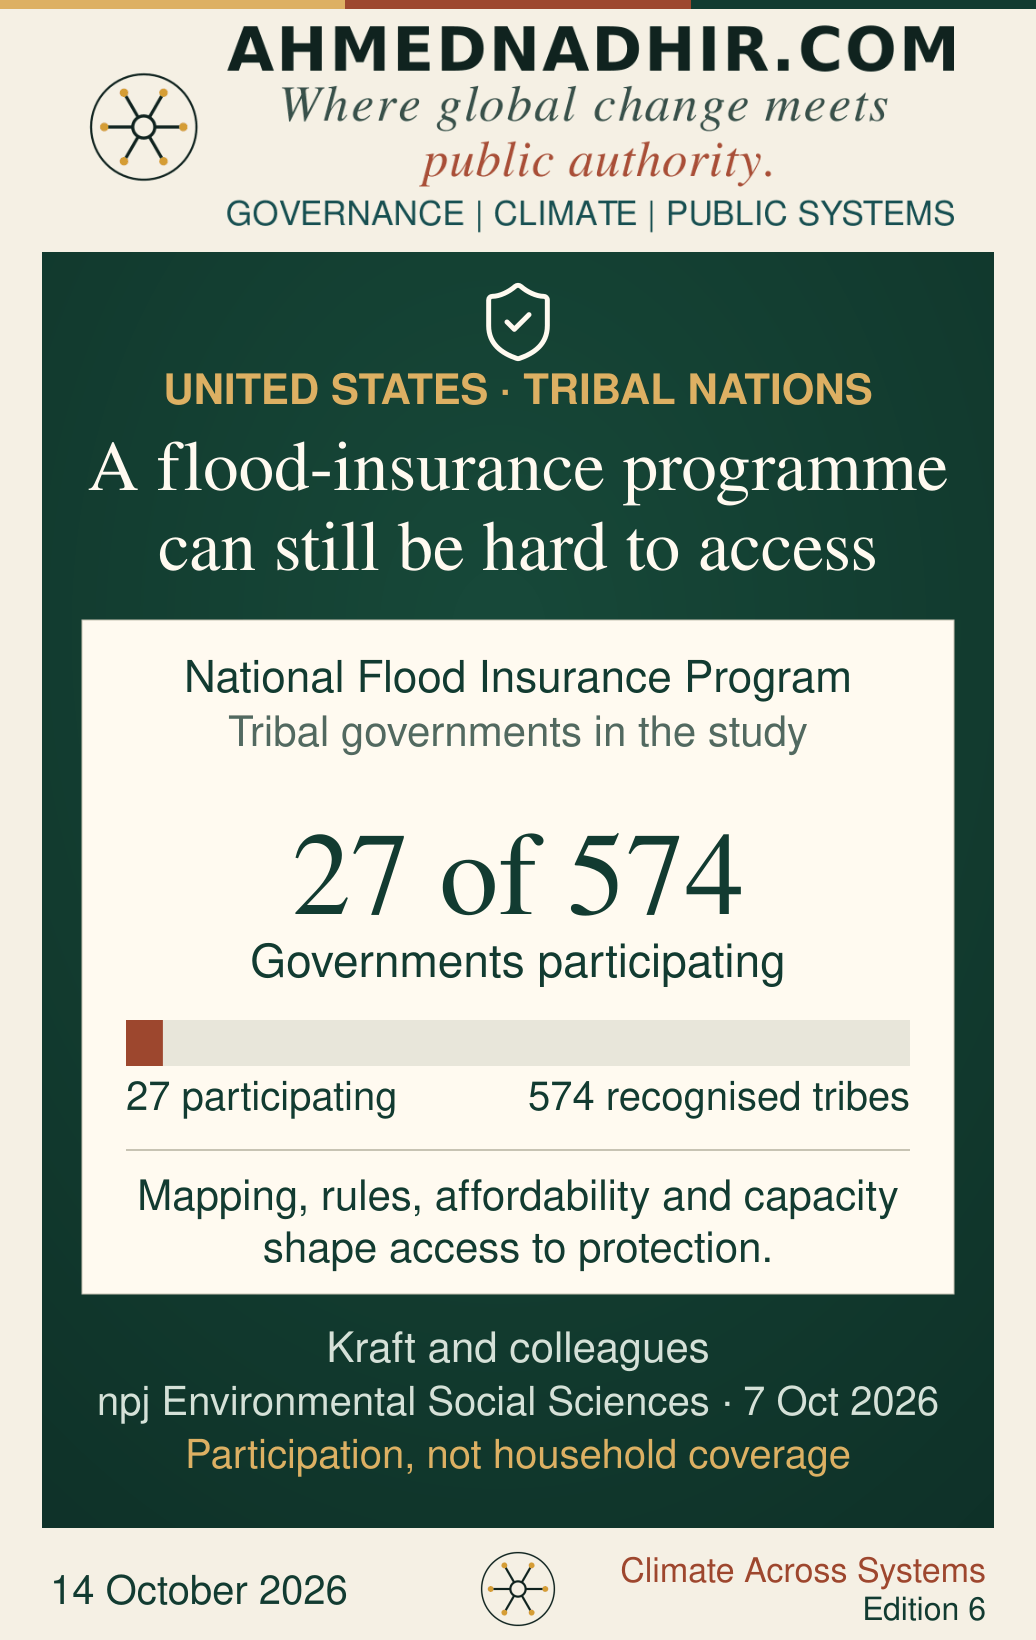
A study combines evidence from flood events, insurance records, 57 Tribal Hazard Mitigation Plans and an interview with a tribal representative. It reports that 27 of 574 federally recognised tribes participate in the US National Flood Insurance Program. That is participation by tribal governments, not the percentage of tribal households insured. The programme is administered by the Federal Emergency Management Agency.
The paper identifies problems involving mapping, administrative requirements, affordability and capacity. Its observational evidence does not isolate the causal contribution of each barrier. Nor does one interview represent the experience of every Tribal nation. Its contribution is to make the route into recovery resources part of the resilience question.
A funding instrument can be formally available while the institutions or people most exposed struggle to use it. Offering a cheaper policy may not resolve an eligibility or mapping problem. Improving an application process may not make premiums affordable. The appropriate response depends on which constraint is decisive, and on the institution with power to change it.
In this US setting, federal programme rules and tribal decisions sit in a particular relationship shaped by sovereignty and land arrangements. It would be misleading to translate that relationship directly into Kenyan national or county administration. The narrower relevance lies in the distinction between low demand and barriers involving eligibility, access costs, information or payment conditions.
For an African programme, the cost of participation forms part of the cost of protection. Administrators control eligibility and assistance; financial providers control specified product and servicing decisions. Local evidence would establish where the decisive barrier lies in a named scheme.
Across connected systems
Food, power and protection carry connected costs
These readings change the choice being compared. Food supply requires attention to both crop performance and the land on which production expands. Cooling makes heat protection depend on electricity, while the way electricity is supplied affects pollution and cost. A household’s ability to change its energy use depends partly on equipment, housing and finance. Insurance access depends on rules and information as well as the product offered.
The central finding is that an input measure can be useful without being a sufficient account of value. More irrigated land, more installed power or more finance offered can support progress. The next comparison concerns the dependable output, usable service or affordable protection produced under the relevant conditions. That comparison can justify new investment, changes to existing arrangements, or a combination of the two.
Public and private decisions distribute those costs differently. Regulators control permissions, standards and specified tariffs. Public finance institutions allocate support within lawful budgets. Developers, lenders, farmers and operators make investment and operating commitments. Communities and households contribute knowledge and bear consequences. A permission establishes what is allowed; funding determines what can be paid for; practical capacity affects whether the benefit reaches people. The return depends on how these distinct commitments come together.
Authority, finance and delivery sit in different hands
The link between a public decision and a household benefit runs through several institutions. Each controls a different permission, payment or practical commitment.
| Decision | Institutions and actors | What the decision changes |
|---|---|---|
| Irrigation and food supply | Water allocation limits feasible output; energy and repayment costs affect returns to farmers and lenders. Production, trade and storage address different supply risks. | |
| Wetland conversion | Conversion commits production and livelihoods to a location. Flood exposure and existing uses affect its return relative to improvements elsewhere. | |
| Electricity flexibility | Procurement defines the reliability service and assigns payment exposure. Tariff and contract decisions affect how costs reach consumers. | |
| Household climate-policy costs | Prices, standards and support shape both the burden and households’ capacity to change their energy use. | |
| Access to recovery finance | Eligibility, assistance and product terms affect who can participate and the cost of reaching them. |
Responses under examination
An irrigation investment joins three distinct decisions
An irrigation investment brings together a water permission, a financing decision and, where relevant, a claim on public support. Each has a different purpose. A water allocation establishes access to a scarce resource; a lender evaluates repayment; a subsidy commits public money to an expected benefit. Approval in one part does not settle the others.
The return depends on how the same production objective could be met. New irrigation, improvements on existing farms, and changes in crop or water management carry different demands for water, electricity, capital and labour. A higher projected yield can be offset by operating costs, repayment terms or losses during difficult seasons.
For farmers and financiers, the immediate exposure lies in output and cash flow. For public authorities, it also includes other water users and the benefit purchased with support. Local agronomy, allocation, tariffs and financing terms determine the balance. The studies identify reasons for this comparison; they do not establish the performance of a particular project.
Evidence to follow
What remains unresolved in the investment choice
| Field | Evidence needed | What remains unresolved |
|---|---|---|
| Crop and land evidence | Local validation, water availability and project-level alternatives | The balance between additional output, exposure and operating costs in a particular investment. |
| South African procurement | A final determination, tender requirements and contractual allocation of costs | The reliability purchased and total cost of the final package relative to feasible alternatives. |
| Household policy appraisal | Local distributional analysis and realistic access to support | The burdens remaining for households with similar incomes but different costs or capacity to change. |
| Insurance and recovery finance | Local participation data, eligibility and access costs | The decisive barrier to useful participation, and the effect of removing it. |
Evidence and limits
The sources and the reach of the conclusions
The principal research was published from 7 to 13 October 2026. Kenyan statistics and institutional records are explicitly dated or standing background. Global, US and EU findings are not treated as measurements of African outcomes. The comparisons and discussion of investment choices are independent interpretation.
- Luo and colleagues. Refined crop modelling reveals intensifying impacts of droughts and heatwaves on global wheat productivity. Nature Food, 8 October 2026.
Primary research. Published abstract reviewed; full methods were not accessible. Historical modelling for 1981–2015, not a forecast for Kenya.
- Zhang and colleagues. Limited agricultural gains but high flood risk from global wetland reclamation. Nature Sustainability, 9 October 2026.
Primary research. Published abstract, figure captions and data-availability record reviewed. Full methods were not accessible. Converted cropland identified for 2000–2022; exposure is distinct from realised loss.
- Zhong and colleagues. Amplified fossil dependence and environmental burden during temperature extremes amid the low-carbon energy transition. npj Climate and Atmospheric Science, 7 October 2026.
An analytical Comment using US power-system, temperature and emissions data. It does not evaluate South African or Kenyan procurement options.
- Vandyck and colleagues. Enhancing fairness in climate action through policy packages. Nature Climate Change, 13 October 2026.
Primary EU scenario modelling of pricing, regulation, subsidies and transfers. Distinguishes within- and between-income-group impacts. It is not an observed evaluation of Kenyan policy or voter behaviour.
- Kraft and colleagues. Tribal nations’ flood exposure and the U.S. national flood insurance program. npj Environmental Social Sciences, 7 October 2026.
Primary exploratory Brief Communication. Flood and policy records, 57 plans and one interview; no formal matched causal comparison. Tribal participation is not household insurance coverage.
- South African Department of Electricity and Energy. Minister Ramokgopa prioritises battery storage and gas-to-power, 7 October 2026.
Current official policy proposal. Proposed 4,600 MW storage and 5,000 MW gas-to-power; no final tender terms, award or commissioned capacity inferred.
- Kenya National Bureau of Statistics. Economic Survey 2026, agriculture chapter, wheat supply in 2025.
Dated national statistical background, Table 7.9 and paragraph 7.13. Wheat imports accounted for 89.8 per cent of total wheat supply in 2025. This is not a household expenditure share.
- Kenya Water Resources Authority. Permitting and water-use allocation.
Standing institutional background. Describes abstraction regulation and allocation, including priority for basic human needs and the environment. No new allocation or project approval claimed.
- Kenya National Environment Management Authority. Wetland Regulations.
Standing institutional background on environmental assessment and sustainable wetland use in land-use planning. A particular proposal still requires assessment under applicable law.
- Kenya Energy and Petroleum Regulatory Authority. Economic regulation and electricity tariff overview.
Standing institutional background on tariff, power-purchase and network-service responsibilities. No new tariff decision or contract approval asserted.
Suggested citation: Ahmednadhir.com (2026), ‘What climate investment buys’, Climate Across Systems, Edition 6, 14 October 2026.